
Is the VIX Index due for a "spike"

Key points:
- The VIX Index has a historical tendency to move higher during the August into October period
- However, the size of any increase in VIX during this period has varied widely from year-to-year, with little apparent rhyme or reason
- In this note, we identify one factor that has identified the likelihood of an above-average advance - or not - in roughly 3 out of every 4 years
- If history proves accurate, the VIX Index has a roughly 75% chance of rising by 35% or more from its August 5th level of 15.81 between now and mid-October
VIX Seasonality
There is a lot of chatter on social media these days about VIX Index seasonality, and its tendency to rise ostensibly from late July into October. A chart depicting VIX seasonality over the last 20 years appears below, courtesy of EquityClock.com.
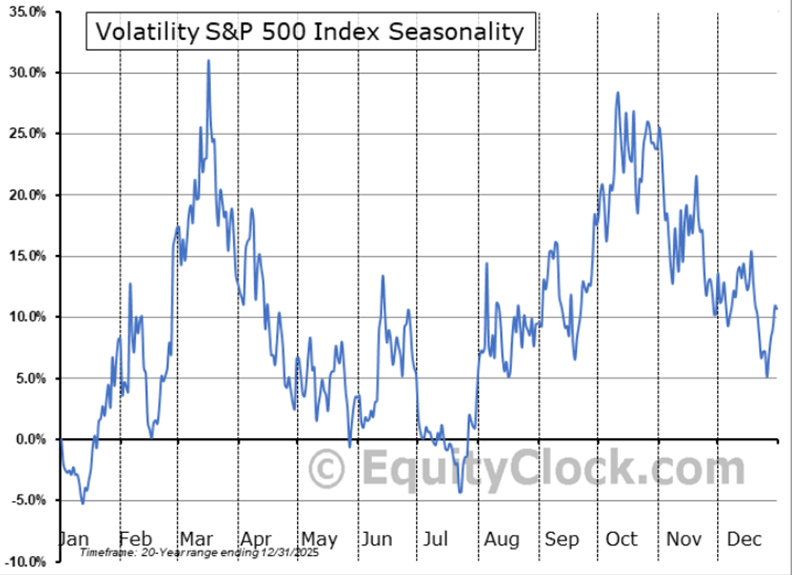
The chart implies a significant increase in VIX from July into October. However, on a year-by-year basis, the results are all over the place. However, we have uncovered one way to get a handle on the likelihood of a significant rise in VIX - or a lack of one.
A simple method for determining